


The U.S. trucking industry underpins virtually every sector of the American economy. In this article—the first in a series of articles this week breaking down FleetOwner’s latest Trucking By The Numbers—we’ve gathered a few interesting metrics that define trucking’s relationship to the country as a whole.
This first installment of Trucking By the Numbers breaks down the foundational benchmarks of industry scale, carrier makeup, and macroeconomic drivers shaping commercial transportation.
But that is a large task: American commercial transportation is big.
The U.S. has 4,208,454 miles of highway
This comes from the Federal Highway Administration’s 2024 Highway Statistics. The nation’s total highway length has slowly inched up over the years—increasing less than 1% annually for some time.
For a vehicle governed at 65 mph, that’s at least 64,745 hours of nonstop driving, or a little over seven years.


Breaking down trucking’s top issues survey: Fuel, CSA, and AI

Werner CEO: Recruiting spending to remain high into ’27


Heavy-duty tractor trailers traveled 192 billion miles in 2024
The Federal Highway Administration (FHWA) regularly estimates vehicles’ miles traveled using states’ Highway Performance and Monitoring System data, fuel consumption data, vehicle registration data, and other
FHWA’s estimated total length traveled for combination trucks was 192,520,000,000 miles in 2024, down 1.6% from 2023’s estimated total. That’s over 45,000 times longer than every mile of the U.S. highway system.
It’s easy to reach that milestone with how many trucks there are in the nation:


The U.S. has 3.5 million registered tractor-trailers.
From the same Highway Statistics table, FHWA estimates that there were 3,482,896 combination trucks in the U.S. in 2024. That’s about 5% higher than in 2023.
It’s interesting that annual change was different between FHA’s total registered trucks and total truck-miles traveled. The population of trucks increased from 2023 to 2024, but their miles decreased. For combination trucks, the ratio of FHA’s registered vehicles to miles changed from about 1 : 58,890 in 2023 to 1: 55,275 in 2024—a 6% decrease in miles per truck.
There are 1,230,273active motor carriers.
It’s trickier to find a confident estimate of the industry’s motor carrier population. This estimate—1,230,273 carriers—comes from the Department of Transportation Company Census File for Trucking and Motorcoaches data.
I filtered the data for only those carriers without an inactive status code and with an MCS-150 updated since January 2023.
The MCS-150 cutoff was generous, so the true population of carriers is likely lower. The messy rollout of the Motus Registration System also makes me skeptical whether this census file accurately tracks MCS-150 renewals since May 2026.
Of those 1.2 million carriers:
- 804,264 are registered as for-hire
- 538,099 are registered for private property
- 121,102 of those are registered for both
Most of those carriers are also one-truck operations: 53.45% of motor carriers are registered with just one vehicle.
Trucks moved 12.8 billion tons and $14.1 trillion in goods in 2024.
From Freight Analysis Framework 5 data: trucks moved about $13,698,711,800,000 in goods in 2024.
The economic value generated from those goods amounted to the largest amount of value added by any transportation sector. The next-largest sectors were air and pipelines.
According to the U.S. Bureau of Economic Analysis, truck transportation contributed$1.05 trillion to the U.S. gross domestic product in 2025, nearly 1% of total GDP.
The economy: Where does freight demand stand?
The economy depends on trucks, and trucking’s $1.05 trillion economic contribution depends on broader economic trends. Carrier demand is tightly related to the big-picture economic metrics.
Where is freight demand now?

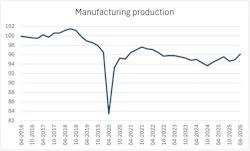
Freight-intensive manufacturing production has fallen 9.6% since 2017, according to the Federal Reserve’s Industrial Production Index: Manufacturing excluding computers, etc.
Housing construction is still weak. The estimate for privately-owned housing starts was down 7.4% year over year in September, according to the Census Bureau’s latest residential construction statistics. New housing starts tend to help boost both flatbed and dry van demand.
A silver lining for flatbed operations: There has been plenty of construction demand for data centers recently. Data center construction spending has maintained a near-exponential growth across the last six years. The U.S. spent over $50 billion on data center construction in 2025, according to the U.S. Census Bureau’s Value of Construction Put in Place Survey.


Retail sales are doing better: the Census Bureau’s measure of advance retail sales are up by about 5% so far in 2026.
Macroeconomic pessimism
Freight demand is highly dependent on overall economic activity, and carriers have many reasons to be skeptical of a boom in new freight demand any time soon.
Inflation is still too high. According to the U.S. Bureau of Labor Statistics, the average year-over-year change in the Consumer Price Index has stood around 4.46% since 2021—more than double the ideal inflation rate of 2%.
10-year treasury yieldspassed 5% for several weeks in a row this year, the highest consistent yields since 2007. Those high yields broadly raise the cost of borrowing, hampering overall investment.
Further raising the cost of borrowing: the Federal Reserve’s interest rate remains around 3.75% to 4%. The federal funds rate has remained elevated for several years, but is still low compared to the rates of the 1980s and 1990s. Rates below 1% are likely not returning any time soon.
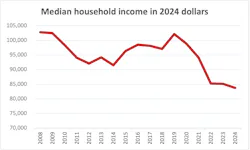
The economic strength of the average consumer has a major impact on freight movement, and the consumer’s condition is looking less chipper these days:
- Consumer income is weakening: The national median CPI-adjusted income was 19% lower in 2024 than in 2008, according to the U.S. Census Bureau income data.
- Total credit card debt is rising: Credit card debt adjusted for inflation in Q2 2026 was 25% higher than a decade prior (Q2 2016), according to the New York Fed Consumer Credit Panel/Equifax.
So how do these macroeconomic factors shape the for-hire trucking market? Tune in later this week. We’ll publish more of Trucking By The Number’s metrics on for-hire rates, ratios, and costs throughout the next few days. Sign up for the FleetOwner Newsletter to find that article as soon as it is live.